
Introduction
If you have ever opened a trading platform and felt overwhelmed by the colorful bars, lines, and numbers moving across the screen, you are not alone. Forex charts can look intimidating at first, but once you understand what each element represents, they become one of the most valuable tools in your trading journey.
In this guide, we will break down the basics of reading a forex chart step by step. Whether you are just starting out or looking to refresh your knowledge, this article will help you understand what the market is telling you and how to use that information to make smarter trading decisions.
What Is a Forex Chart?
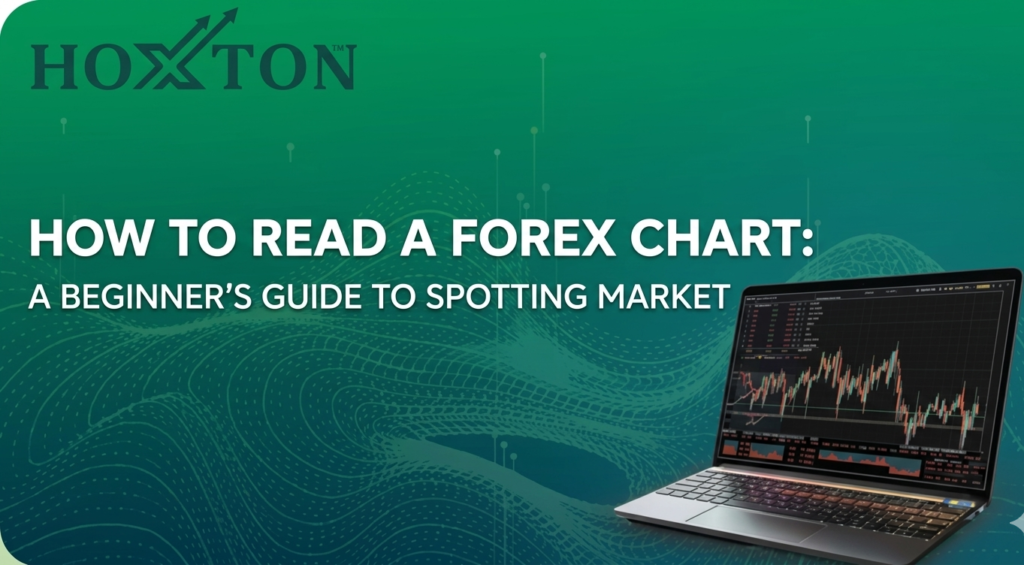
A forex chart is a visual representation of how a currency pair’s price has moved over a specific period of time. It shows you the relationship between two currencies, such as EUR/USD or GBP/JPY, and helps traders identify patterns, trends, and potential entry or exit points.
Each chart displays price on the vertical axis (Y-axis) and time on the horizontal axis (X-axis). The combination of these two pieces of information allows traders to study price behavior and forecast future movements.
The Three Most Common Types of Forex Charts
Before diving into how to read a chart, it helps to know the main types you will encounter on most trading platforms.
1. Line Charts Line charts are the simplest. They connect closing prices over a specific time frame with a single line. They are great for getting a quick overview of the market direction but do not show much detail about price movement within each period.
2. Bar Charts Bar charts give more information than line charts. Each bar represents the opening price, closing price, high, and low for a given period. This makes them useful for understanding price ranges and volatility.
3. Candlestick Charts Candlestick charts are the most popular among forex traders. They show the same information as bar charts but in a more visual way. Each candle has a body and two wicks, and the color tells you whether the price moved up or down during that period.
Most traders prefer candlestick charts because they make it easier to spot patterns and read market sentiment at a glance.
Understanding a Candlestick
Since candlestick charts are the most widely used, let us look at how they work.
A single candlestick shows four key pieces of information for a chosen time frame:
- Open price – the price at the beginning of the period
- Close price – the price at the end of the period
- High – the highest price reached during the period
- Low – the lowest price reached during the period
If the close is higher than the open, the candle is usually green or white, meaning the market moved up. If the close is lower than the open, the candle is red or black, meaning the market moved down.
The thin lines above and below the body are called wicks or shadows. They show the highest and lowest points the price touched during that period.
Identifying Trends on a Forex Chart
One of the most important skills in trading is recognizing the direction of the market. There are three main trend types:
Uptrend – Higher highs and higher lows. Prices are generally moving upward, and buyers are in control.
Downtrend – Lower highs and lower lows. Prices are generally moving downward, and sellers are in control.
Sideways or Ranging Market – No clear direction. Prices move within a horizontal range as buyers and sellers compete equally.
A simple way to confirm a trend is by drawing a trend line. Connect at least two highs in a downtrend or two lows in an uptrend. The longer the line holds, the stronger the trend.
Time Frames Explained
Every forex chart allows you to choose a time frame. This determines how much time each candle represents. Common time frames include:
- 1-minute (M1) and 5-minute (M5) – Used by scalpers for very short-term trades
- 15-minute (M15) and 1-hour (H1) – Popular among day traders
- 4-hour (H4) and Daily (D1) – Used by swing traders
- Weekly (W1) and Monthly (MN) – Used for long-term analysis
Beginners often make the mistake of focusing only on short time frames, which can be noisy and misleading. A good practice is to analyze the bigger picture on higher time frames first, then zoom in to find precise entry points.
Key Indicators to Add to Your Chart
Indicators are tools that help you analyze price movement more deeply. Here are three beginner-friendly ones:
Moving Average (MA) – Smooths out price data to show the overall trend. The 50-period and 200-period moving averages are widely watched.
Relative Strength Index (RSI) – Measures whether a currency pair is overbought or oversold. Readings above 70 suggest overbought conditions, while readings below 30 suggest oversold conditions.
Support and Resistance Levels – These are price zones where the market has previously struggled to move higher (resistance) or lower (support). They often act as turning points in price action.
You do not need to use every indicator available. In fact, too many indicators can clutter your chart and confuse your decisions. Start with one or two and master them before adding more.
Common Mistakes Beginners Should Avoid
- Looking only at one time frame instead of multiple
- Adding too many indicators at once
- Trading without identifying the trend first
- Ignoring major news events that can shift prices quickly
- Trusting their instincts over what the chart actually shows
Conclusion
Reading a forex chart is a skill that improves with practice. Once you become comfortable with candlesticks, trends, and basic indicators, you will start to see opportunities you might have missed before. Charts will not predict the future, but they give you a clear view of how the market is behaving so you can make informed decisions.
At HoxtonFX, we believe traders make the best decisions when they have the right knowledge and tools at their fingertips. Take your time, practice on a demo account if needed, and remember that consistency in learning is what separates successful traders from the rest.
Risk Disclaimer: Trading forex and CFDs involves significant risk and may not be suitable for all investors. You may lose part or all of your invested capital. Always seek independent financial advice before trading.